
Total fees paid by consumers have appeared stuck at ~200bps despite many changes in the industry in recent years. However, NMG data shows that prices in all key components of the value chain are falling.
The UK wealth industry value chain has been resilient over the past decade, despite many changes including rapid growth in AUM, the rise of platforms as a dominant method of distribution to consumers, and access to wholesale or institutional pricing from asset managers.
Yet the total end price to consumers seems to have remained at ~200bps. There has been more evidence of reshuffling the value chain than shrinking it.
The reality is better than appearances suggest. NMG’s UK Distribution Insights provide a robust long-term view of advisers’ perspectives of fees for ongoing advice, asset management, and platforms. While advice, asset management, and platforms don’t represent the whole industry value chain, they represent the majority of the end price paid by the consumer.
Figure 1 shows that average total fees for advice, asset management, and platform have fallen from 180bps in 2012 to ~164bps in 2018. Most years have seen a contraction of 2-3bps – the exception being 2015 which coincided with pensions freedoms.
FIGURE 1: VALUE CHAIN CONTRACTING ~ 3BPS PA
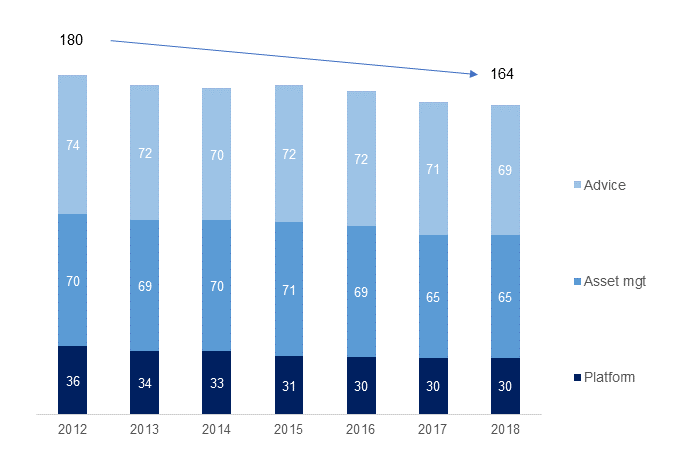
Source: NMG UK Distribution Insights
So there has been material progress in lowering costs for consumers. There has been a similar contribution from (or similar pain for) all three components, each giving up 5-6bps.
Platforms and asset managers have seen reductions in pricing power (both headline and tiering); they may feel that Figure 1 understates their experience. Advisers less often discount their headline fees (they often rose over 2012-18 in fact), but have offered tiers or discounts to the larger customers which have made up an increasing proportion of client bases.
However the decline in the averages conceals stickiness in prices of the components. Whether for advice, asset management, or platforms, fees tend to be steady for a number of years, before gapping down. This is reflected in Figure 2 below.
FIGURE 2: TYPICAL COMPONENT PRICES ARE STICKY FOR EXTENDED PERIODS
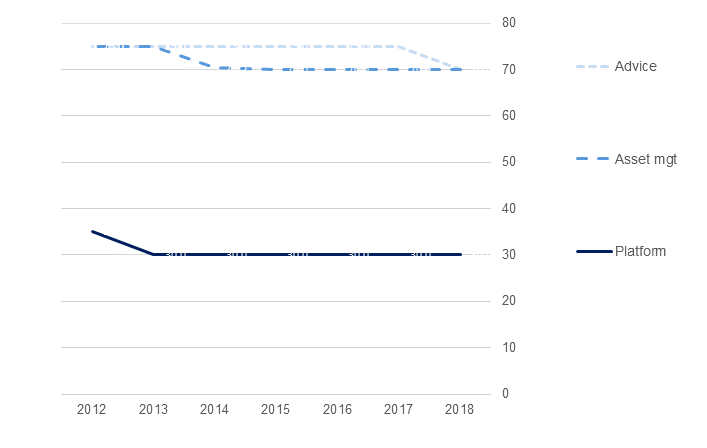
Source: NMG UK Distribution Insights
Figure 2 suggests an industry with considerable price inertia. How do we reconcile this with the steady decline in average prices in Figure 1?
- Average and median fees for platforms have been very similar, but for advice and asset management the average has typically been well below the median.
- Flat median prices mean that an industry “standard” fee charged by advisers tends to persist for some time, and advisers tend cluster around “round number” fees.
- Lower average prices reflect downside dispersion below that “standard” – ie a significant minority of advisers reduce asset management and advice fees for larger clients (whether via fees cuts and / or volume effects).
- Those price reductions become increasingly widespread amongst advisers, and eventually the median fee gaps down.
The industry value chain also provides a perspective of where future price compression is likely. If an adviser wants to (or must) materially cut costs for their customers – say by 10bps or more – where will it come from?
It’s likely that all components will make some contribution again, but that some will make a bigger contribution than others:
- Despite recent industry noise on the topic, the platform component is least prospective. There’s only ~30bps to start with, so taking out 10bps+ is a huge move. Smaller price cuts are realistic, ideally via price renegotiation. The alternative – switching clients across platforms – is a complex and costly project for both adviser and client. Potential fees savings vs the upfront costs plus downside risk may not be an attractive trade-off.
- The obvious target is asset managers. Median asset management fees (including DFMs) are still 70bps, despite rising penetration of passive products. If an adviser needs to find 10bps+, this is where they will look for most of it.
- Of course, advisers could cut their own fees! Advice is now the largest part of the value chain. Average advice fees will continue to fall, but mostly via volume effects – advisers are reluctant to materially lower their headline fees, and being closest to the customer they have strong pricing power.
The data reveals a UK wealth industry with much price movement below the surface. Price and margin pressure will remain intense for platforms (where asset scale is critical), and for asset managers (the most accessible source of fee savings). We can expect more exits and consolidation in those parts of the value chain. However with a combination of high prices and limited innovation, advice must look very ripe to disruptors offering technology and business model innovation.
For more information, contact:
Andrew Baker, Partner (London; [email protected])
Ralph O’Brien, Senior Consultant (London; [email protected])
Charles Lake, Principal Consultant (London; [email protected])
